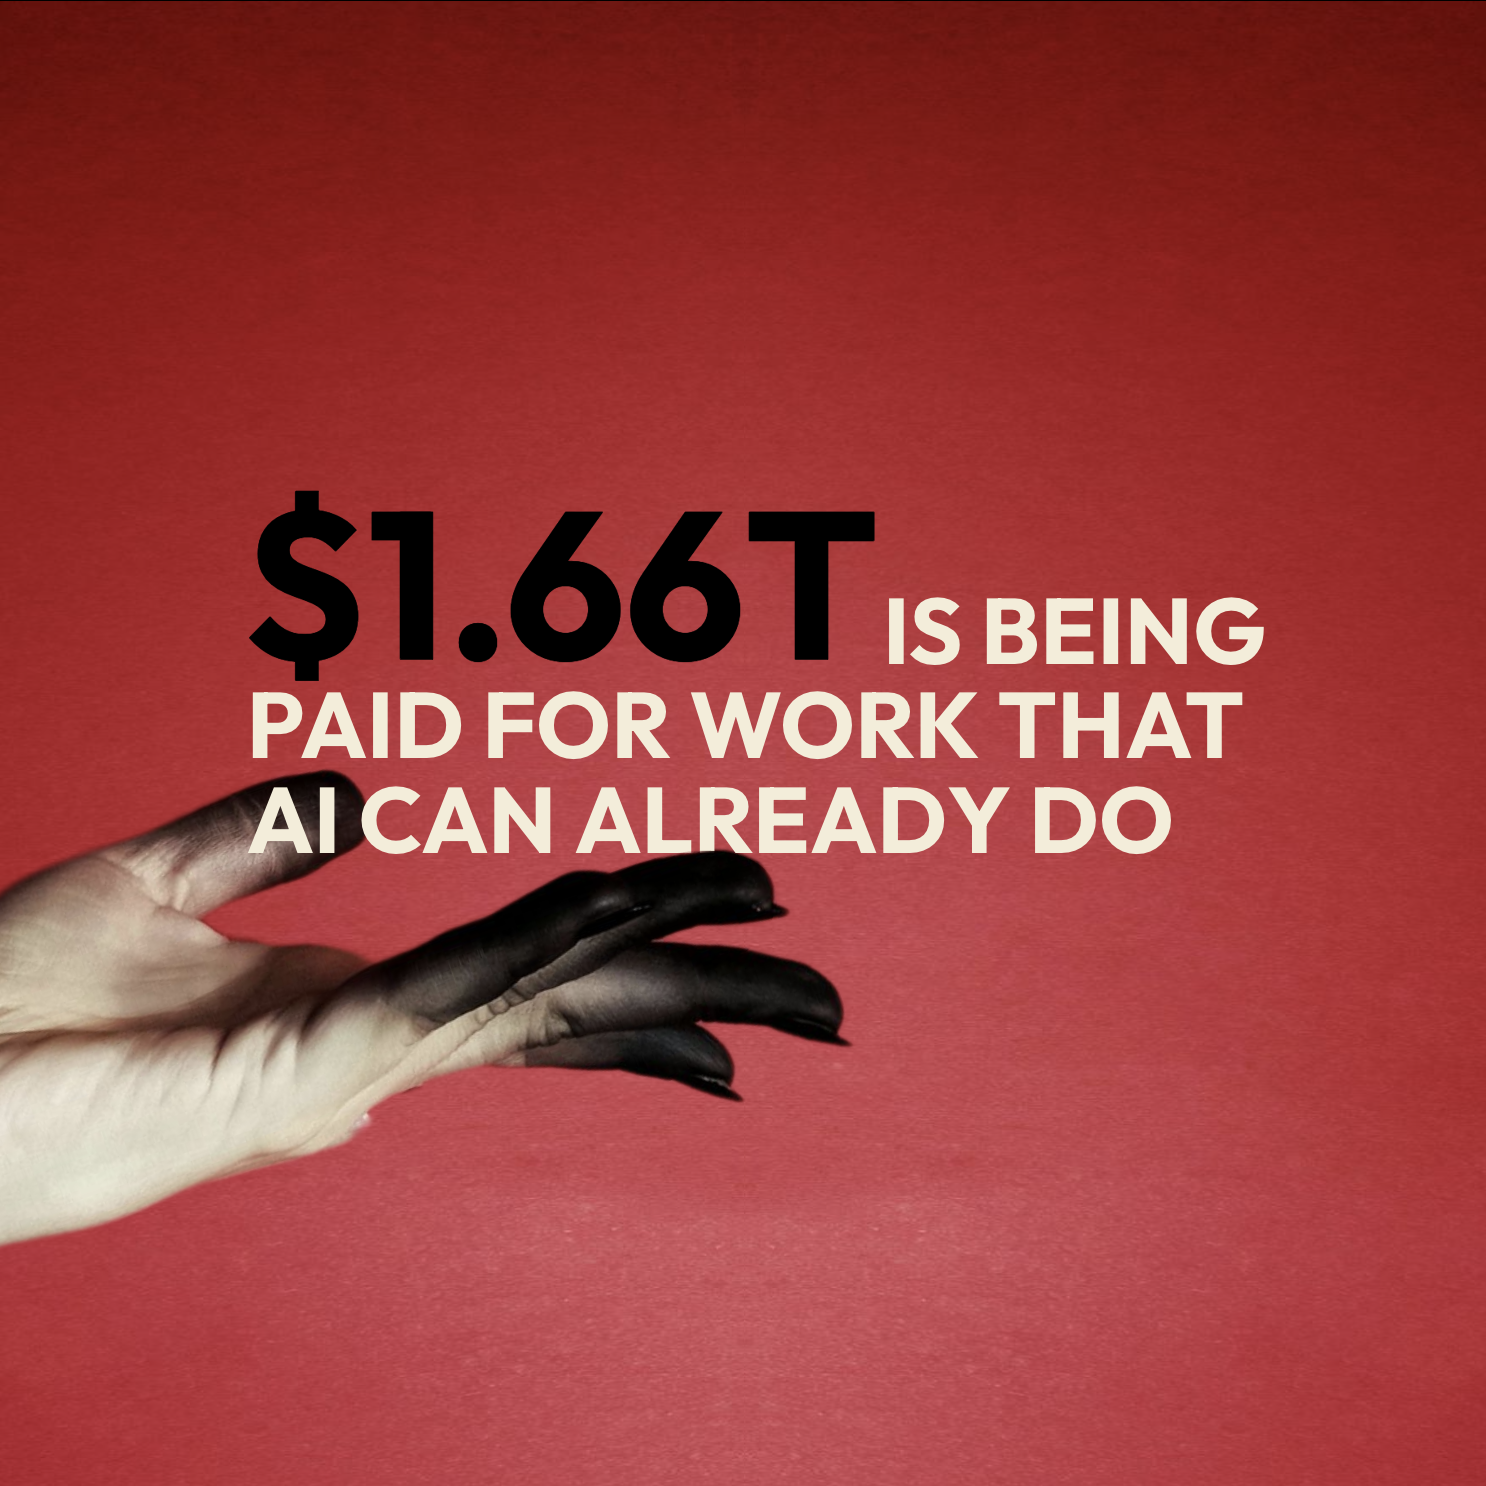
$1.66T is being paid for work that AI can already do
Anthropic just told us what people use Claude for.
We calculated what that costs.
Anthropic’s Economic Index just measured millions of Claude chats and published what people actually use AI for at work. Their finding: 49% of U.S. occupations now have at least a quarter of their tasks being handled by AI.We did the math on what those tasks cost:
$1.66 Trillion in annual U.S. knowledge-worker compensation going to tasks AI can perform end-to-end today. Another $1.67T is in co-pilot territory, where an AI can power the work. Together: 73.7% of all knowledge-worker pay is exposed.1
“Exposed” doesn’t mean “eliminated.” AI can do a task and still require a human for judgment, liability, trust, or because nobody’s built the integration yet. These numbers measure the surface area where decisions need to be made. Not the decisions themselves.
And, yeah, $1.67 trillion is a crazy number. The error bars range from $852 billion to $2.27 trillion (plus or minus ~40%), a span of $1.4 trillion. That’s roughly Tesla’s market cap. The range is enormous because it takes real judgement calls to rate millions of tasks for AI capability. But even the conservative floor is nearly a trillion dollars, spread across every US employer.
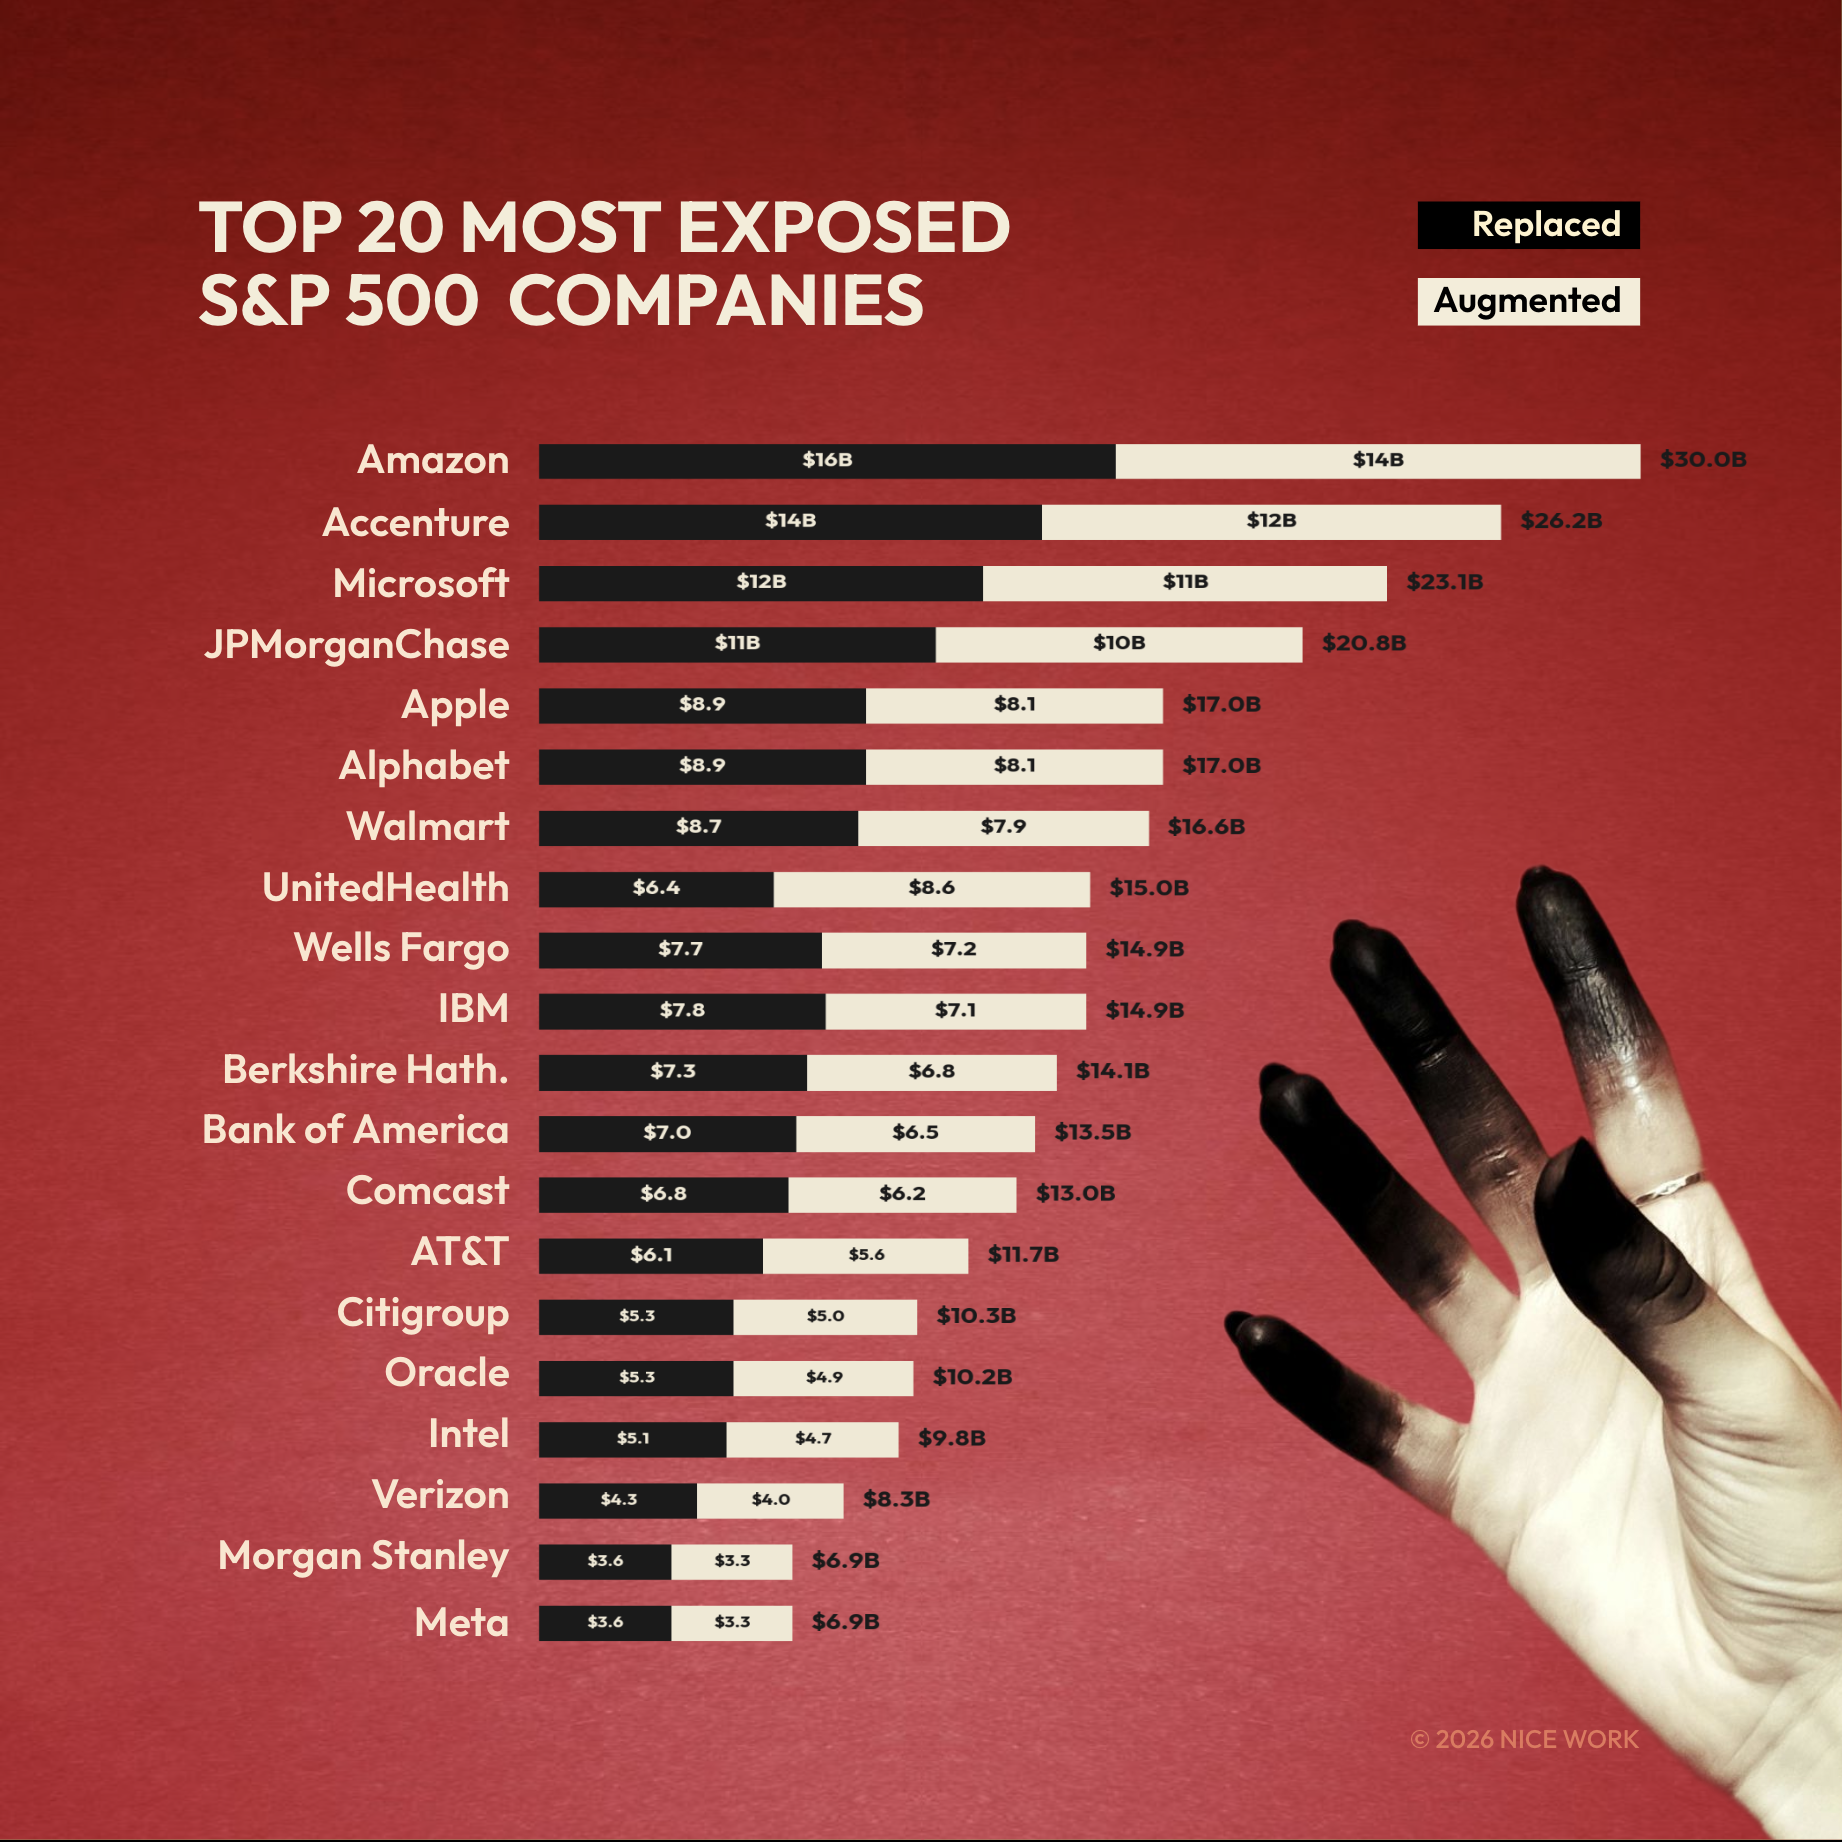
The 20 Companies With the Most Exposed Payrolls
To run this analysis, we created a metric we’re calling Automation-Exposed Labor Spend (AELS). It measures the dollar value of salaries going to tasks AI is technically capable of performing right now.
We ran that analysis on 99 of the largest S&P 500 companies, adjusted for where their knowledge workers actually live. The “Geo-Adjusted” column reflects real compensation in real geographies. The “Unadjusted” column applies nominal U.S. wages across every role.
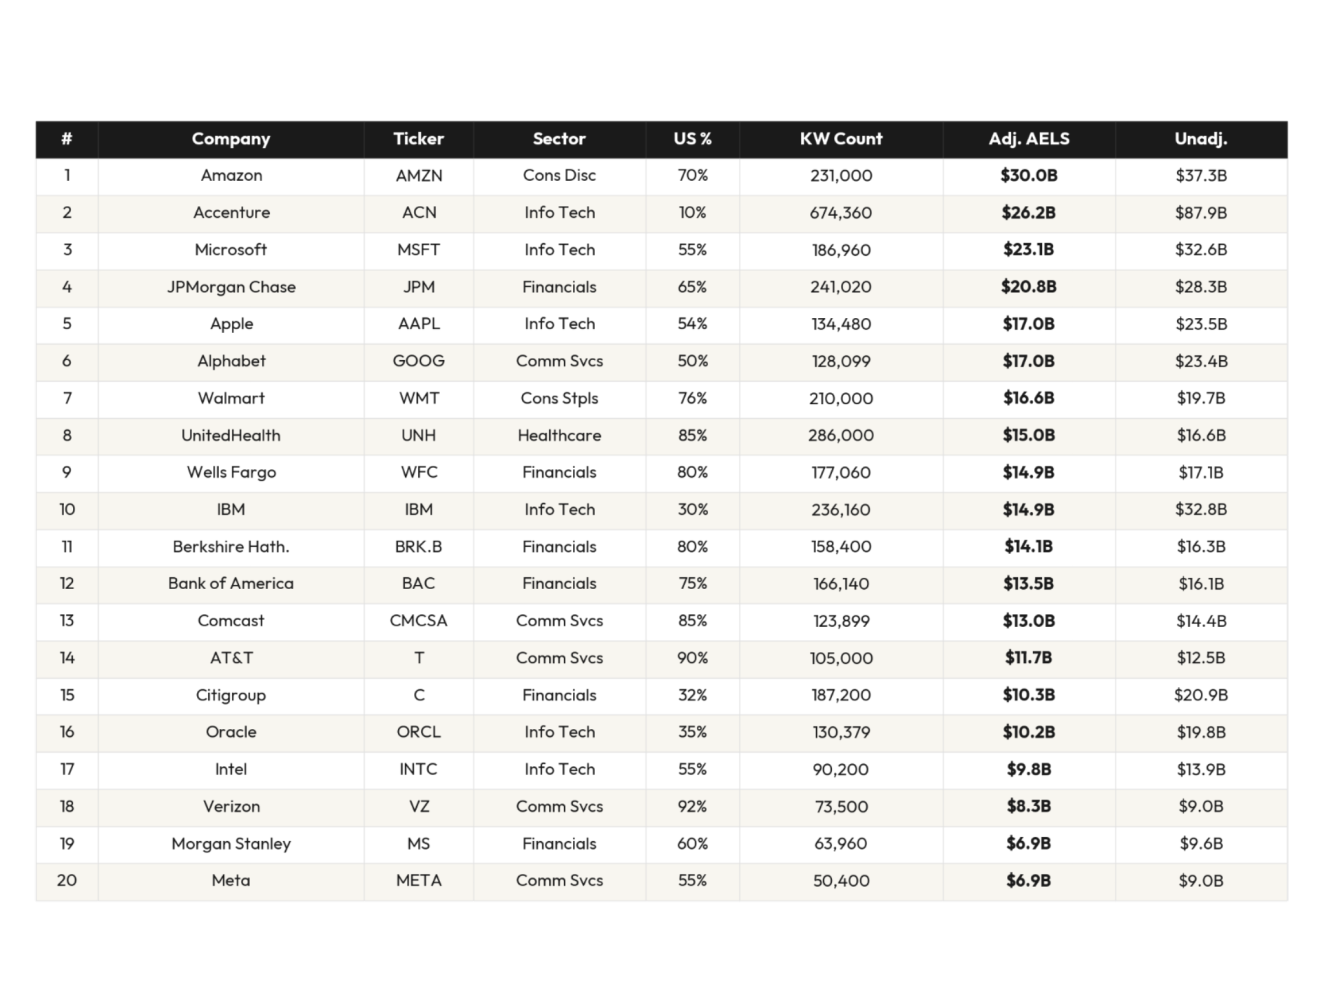
Amazon leads—paying people $30 billion for tasks AI can handle. Seventy percent of its knowledge workers sit in the United States doing analysis, coding, and operations that score high for AI capability.
Accenture is second. Although they have hundreds of thousands more knowledge workers, 90% of its 733,000 employees work outside the U.S. at a fraction of American wages. We see a similar pattern for other big outsourcers: IBM is tenth. Citigroup is fifteenth. Any task routine enough to offshore is usually routine enough to automate.
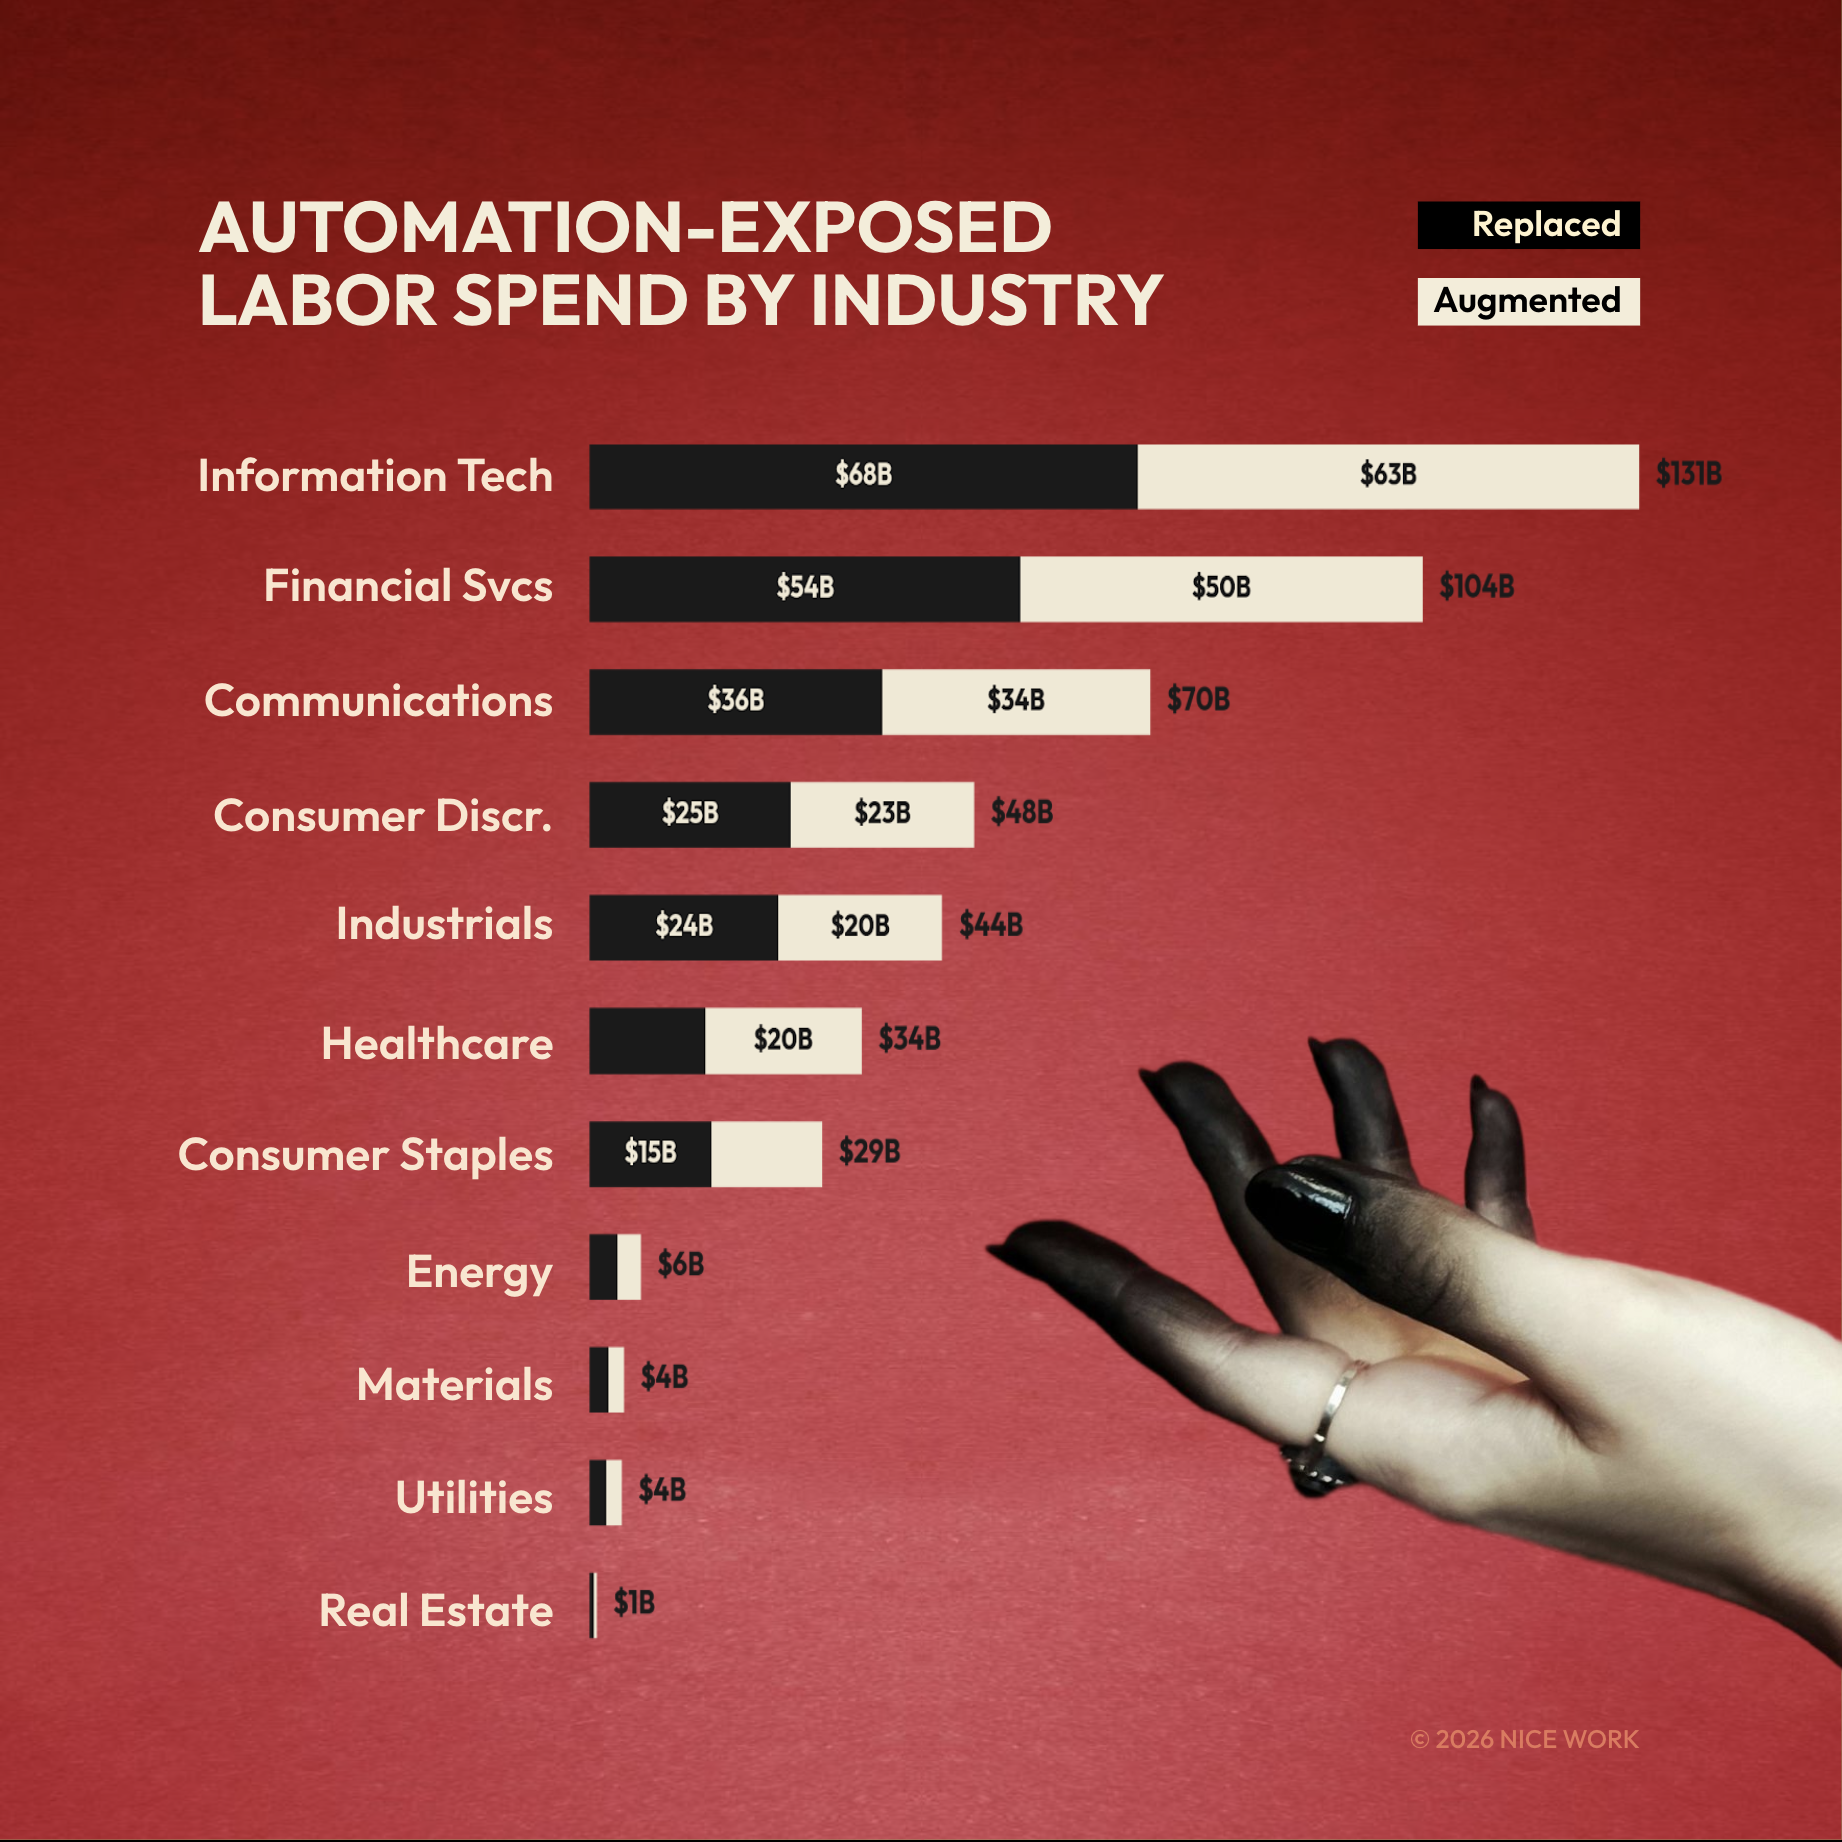
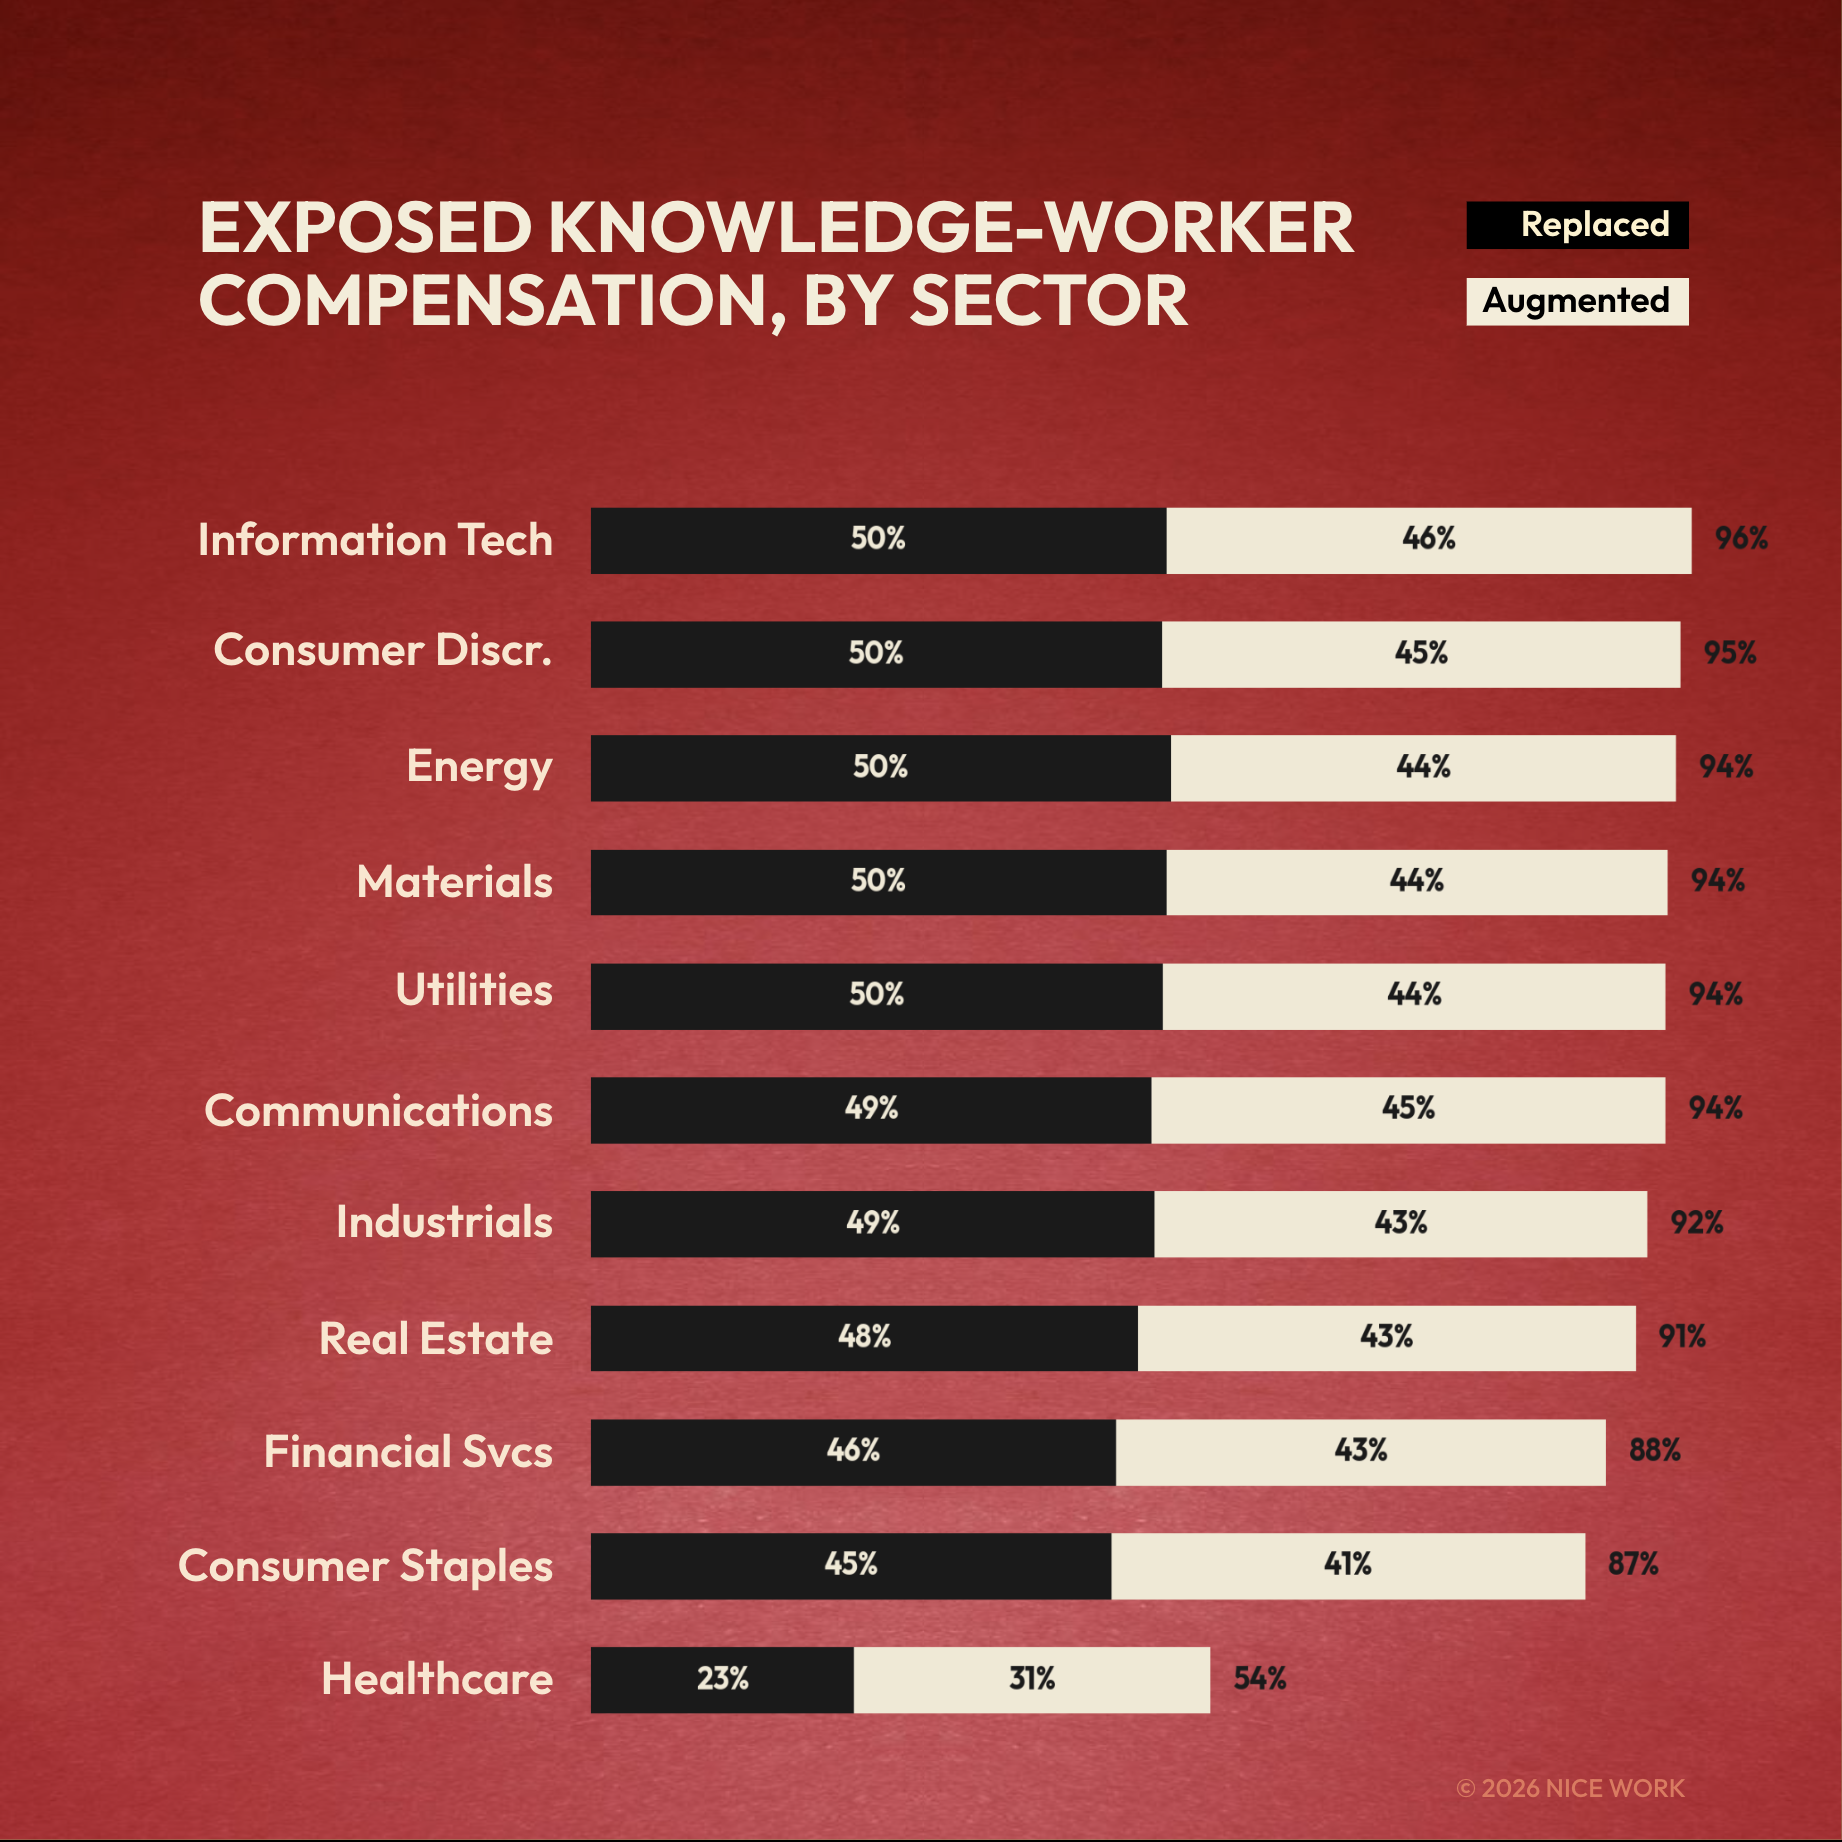
The View by Sector
IT carries the most exposure at $131 billion. Financials follow at $104 billion. Healthcare is the outlier: UnitedHealth lands in the top 10 due to insurance administration, but clinical roles scored just 0.5% replacement exposure. Doctors, nurses, and technicians remain the lowest-exposure occupation group by a wide margin.
What This Means for a Team
The 37% of tasks that scored highest for AI share three traits: text-based, template-following, and objectively verifiable. First-draft writing. Data formatting. Meeting summaries. Compliance checklists. Standard reporting. Where a human doesn’t add judgment, they just add keystrokes.
That doesn’t mean 37% of knowledge workers should get fired tomorrow. Just because AI can perform a task doesn’t mean a company has deployed it, integrated it, or figured out what the remaining workers should do instead.
A financial analyst spending three hours building a quarterly report from templates is adding keystrokes, not insights. The same analyst interrogating the data and writing the paragraph that changes a CEO’s mind? That’s work worth protecting.
That’s the strategic challenge.
Anthropic’s data shows experienced AI users aren’t just faster. They’re working on fundamentally harder problems, averaging one full education level higher in task difficulty. That gap compounds quarterly. Organizations six months in are already pulling away from those still debating pilot programs. The companies that will win this transition treat it as a redesign problem. Not “how many people can we eliminate?” but “what should our teams look like now?”
The $1.66 trillion isn’t a forecast for layoffs. It’s a price tag on the redesign opportunity. Companies that move first get to choose what comes next. Companies that wait get the choice made for them.
It takes zero imagination to eliminate a job. It takes tremendous imagination to invent new ones. Too many companies are taking the zero approach.
How We Did the AELS Math
Supply side. The Department of Labor’s O*NET database breaks every U.S. occupation into component tasks: 6,700 in all. Three AI models (Claude 3.5 Sonnet, Gemini 2.5 Pro, GPT-5) independently rated each task for AI technical capability on a 0–100 scale. We cross-validated scores, linked them to BLS wage and employment data from May 2024, and computed AELS at the occupation, sector, and company levels. National totals: $1.663T replacement, $1.668T augmentation, across 213 occupations and 49.4 million knowledge workers.
Demand side. Anthropic’s Economic Index (March 2026) measures actual AI usage from millions of Claude conversations. Three findings matter here. First, AI usage is spreading beyond engineering into management, strategy, and operations. Second, experienced users tackle tasks one full education level harder than beginners, with 10% higher success rates. Third, the real automation runs through APIs, not chat windows.
Company-level adjustments. We estimated each company’s U.S. workforce share from 10-K filings and public disclosures, then applied regional wage factors reflecting what workers earn in India, the Philippines, Eastern Europe, and other major offshore markets. Data quality varies: 6 companies have high-confidence geographic breakdowns, 64 medium, 29 lower. Treat company-level figures as estimates, not measurements.
Caveat on the demand side: Anthropic is a vendor. They sell Claude. No comparable dataset exists from a neutral party. Their findings align with our independent supply-side analysis, but readers should note the source.
The Boring Part: Methodology & Limitations
Task-Level Rating Design. All 6,700 task statements from the O*NET 28.3 Content Model were rated for AI capability on a continuous 0–100 scale. The primary rater (Claude 3.5 Sonnet) rated all 6,700 tasks. A stratified 30% sample (n = 2,009 tasks) was independently rated by Gemini 2.5 Pro, and a 10% sample (n = 663) by GPT-5-thinking. Tasks were presented with occupation title, SOC code, importance rating, frequency rating, GWA cluster, SOC major group, and an exogenous quality floor (described below). Raters also produced a physical-task percentage estimate (0–100) and free-text evidence for each rating.
Inter-Rater Reliability. IRR metrics across the three-model panel: ICC(2,1) = 0.41 (moderate agreement), Spearman ρ = 0.58, Mean Absolute Difference = 15.2 points on the 0–100 scale. These figures represent substantial improvement over pre-harmonization values (ICC = 0.13, ρ = 0.31, MAD = 22.8). The moderate ICC is consistent with the inherent subjectivity of AI capability assessment and comparable to human expert agreement rates reported in Eloundou et al. (2023) for similar rating tasks.
Score Adjudication. Final task-level scores were adjudicated as follows: for the 663 tasks rated by all three models, the median score was used; for the 1,346 tasks rated by Claude and Gemini only, the mean of the two scores was used; for the remaining 4,691 tasks, the Claude v3 score was used. This approach reduces single-model bias where multi-model data is available while preserving coverage for the full task universe.
Quality Floor (QF) and Threshold Design. Each occupation was assigned an exogenous quality floor (QF 1–5) derived from three inputs: O*NET Work Context scores (consequence of error, responsibility for outcomes, importance of precision), SOC major group, and annual median wage quintile. SOC groups 21 (Community & Social Service), 25 (Education), and 27 (Arts/Design/Media) received a minimum QF bump from 1 to 2 based on domain-expertise requirements not captured in Work Context scores. Replacement thresholds are QF-dependent: QF1 → 45, QF2 → 55, QF3 → 70, QF4 → 85, QF5 → 95 on the 0–100 AI capability scale. A task is classified as replacement-grade when its adjudicated AI capability score meets or exceeds its QF-adjusted threshold AND its physical-task percentage is ≤ 20%. Augmentation classification requires AI capability ≥ 40 and physical percentage ≤ 50%, with a weight of (ai_capable / 100).
AELS Calculation. For each occupation, task-level time weights are computed as (importance × frequency) / Σ(importance × frequency). The replacement share is the sum of time weights for replacement-classified tasks. The augmentation share is the sum of (time weight × augmentation weight) for augmentation-classified tasks. AELS is then: replacement_share × annual_median_wage × employment, summed to occupation and sector levels. National totals: $1.663T replacement AELS (36.8% of knowledge-worker compensation), $1.668T augmentation AELS (36.9%), across 213 occupations and 49.4 million knowledge workers.
Company-Level Extension. S&P 500 company-level estimates map each company’s GICS sector classification to BLS industry-occupation staffing patterns (OES May 2024) at the SOC major-group level. Each sector receives a knowledge-worker share estimate (the proportion of total headcount in SOC 11–29 occupations) and an occupational mix profile. Company-specific overrides adjust the knowledge-worker share for firms with known atypical workforce compositions: e.g., Amazon (kw_share = 0.15, reflecting ~85% warehouse/logistics), Accenture (kw_share = 0.92, reflecting near-total knowledge-work workforce), UnitedHealth Group (kw_share = 0.65, insurance/admin heavy). AELS at the company level equals (knowledge-worker headcount) × (sector median compensation per KW) × (weighted-average AELS rate from occupational mix).
Sensitivity Analysis. The national AELS figure is sensitive to threshold assumptions. Four scenarios were tested: Strict (all thresholds +20 points; $139B), Conservative (QF thresholds +10; $852B), Base (QF-adjusted thresholds as described; $1,663B), and Aggressive (all thresholds −10; $2,270B). Physical-task threshold sensitivity was also tested at 10%, 20% (base), 30%, and 50% cutoffs. Adjudication method variants (Claude-only, Gemini-only, mean-of-available, median-of-available) produced AELS estimates ranging from $1,450B to $1,820B, suggesting moderate sensitivity to rater weighting.
Construct Validity. Occupation-level mean AI capability scores correlate at Spearman ρ = 0.594 with Eloundou et al.’s (2023) GPT-4 exposure beta scores and at ρ = 0.52 with Felten et al.’s AI Occupational Exposure index. The direction and relative magnitude of sector-level exposure align with Anthropic’s Economic Index (March 2026) actual-usage measurements, with Computer & Mathematical occupations scoring highest on both technical capability and observed adoption.
Known Limitations. (1) LLM raters assess technical capability, not deployment readiness, organizational willingness, or regulatory permissibility. AELS measures exposure, not impact. (2) The three-model panel introduces a batch effect across the seven parallel Claude re-run agents (batch means ranged 41.7–56.5; F = 77.25, p < 0.001), though occupation-level impact was assessed as negligible (mean shift = 0.8 points, rank ρ = 0.988). (3) Company-level estimates assume sector-average occupational mixes within each firm’s knowledge-worker population. Actual staffing patterns vary by company strategy, geography, and business mix. (4) Publicly available headcount data may lag actual staffing levels. (5) The study covers SOC major groups 11–29 only (knowledge-work occupations); service, production, and trade occupations (SOC 31–53) are excluded by design. (6) AI capability assessments reflect model capabilities as of early 2026 and will require periodic re-rating as models improve.
Data Availability. Full study protocol, task-level ratings, occupation-level AELS estimates, sensitivity tables, and company-level estimates are available on request. Contact: joe@nice.work